INTRODUCTION
Tobacco product display has become one of the tobacco industry’s most important forms of tobacco promotion as restrictions have increasingly been placed on tobacco advertising1. A large body of evidence2-8 shows that exposure to point-of-sale (POS) tobacco promotion is positively associated with smoking and smoking susceptibility among adolescents. Article 13 of the WHO Framework Convention on Tobacco Control (FCTC) obligates the Parties to the treaty to prohibit ‘any form of commercial communication, recommendation or action with the aim, effect or likely effect of promoting a tobacco product or tobacco use either directly or indirectly’9. The guidelines for the implementation of Article 13 directly state that ‘Display and visibility of tobacco products at points of sale constitutes advertising and promotion and should therefore be banned10.’
Previous studies have shown that a tobacco POS display ban can decrease adolescents’ observation of tobacco products in stores. In Ireland, adolescents’ recall of tobacco product displays decreased from 81% before the display ban to 22% after its implementation in 200911. A less dramatic decline (from 80% to 64%) occurred among adolescents and young adults following a display ban in Australia in New South Wales in 2010 and in Queensland in 20112. In 2012, tobacco POS displays were banned in large shops in England; the proportion of children noticing tobacco products in supermarkets decreased from 60% to 46%12.
Even though previous studies have shown a decrease in noticing tobacco products displayed after the ban, the follow-up times have been limited, and differences by types of shops have not been studied. Retailers may expect to see a reduction in sales as a consequence of the ban, which may reduce retailers’ adherence to the ban. Since adherence and enforcement may decline over time, it is important to monitor exposure to POS displays over a long period.
In Finland, the display of tobacco products and their trademarks at the POS were banned in a provision to the Tobacco Act in 2010, and subsequently implemented at the beginning of 201213. In practice, this means that all tobacco products have to be kept in closed containers, cabinets or drawers, or behind sliding doors or similar kinds of arrangement. This ban also applies to smoking accessories if they have a tobacco product trademark. Upon request of a customer, the retailer can show a printed catalogue or a list of tobacco products and their sale prices, given that the list does not have any promotional elements.
While most countries with tobacco display bans still allow the display of electronic cigarettes (e-cigarettes), Finland extended the display ban to e-cigarettes through a revision of the Tobacco Act in August 201614. Until 2016, nicotine containing e-cigarettes were regulated under the Medicines Act, and thus regular retailers were not allowed to sell these products. However, between 2012 and 2016, regular retailers were able to display non-nicotine e-cigarettes. Previous studies have shown an association between adolescents’ observation of e-cigarette displays and susceptibility to and use of e-cigarettes among adolescents15,16. It is therefore important to monitor the exposure to in-store displays of e-cigarettes.
The aim of this study was to investigate the changes in Finnish adolescents’ observation of tobacco products on display in shops, kiosks and service stations from 2011 (before the display ban) until 2017 (after the display ban) using data from 2011, 2013, 2015 and 2017. To our knowledge, this is the first study that has examined adolescents’ exposure to the POS display of e-cigarettes and which has monitored the long-term trend of adolescents’ exposure to displayed tobacco products at point of sales.
METHODS
Sampling and participants
Data were analysed from the 2011, 2013, 2015 and 2017 nationwide Adolescent Health and Lifestyle Surveys. Nationally representative samples were obtained from the Population Register Centre. All Finns aged 12, 14 and 16 years, born on certain dates in June, July or August, were selected. Approvals from the Ethics Committee of the Tampere region were obtained for study protocols. No parental consent was needed, and filling in the questionnaire was considered as the adolescents’ consent to participate.
The same protocol was followed every survey year and questionnaires were mailed to adolescents in February of each survey year, followed by three reminders to the non-respondents. The overall response rate was 45%, ranging from 40% in 2013 to 50% in 2011 (Table 1). The overall response rate for boys was 38% and for girls 52%, while for 12-year-olds it was 47%, for 14-year-olds 38% and for 16-year-olds 42%. The proportion of missing answers was less than 3%.
Table 1
Descriptive characteristics of the study populations and the frequencies of the responses to questions on noticing tobacco products displayed in shops, kiosks and service stations
| Characteristics | 2011 | 2013 | 2015 | 2017 | All years |
|---|---|---|---|---|---|
| Sample, n | 6987 | 6539 | 11749 | 6725 | 32000 |
| Respondents, n | 3478 | 2619 | 5140 | 3083 | 14320 |
| Response rate, % | 50 | 40 | 44 | 46 | 45 |
| Noticed tobacco products displayed in shops | |||||
| Yes, n (%) | 2914 (83.8) | 954 (36.4) | 1954 (38.0) | 1483 (48.1) | 7305 (51.0) |
| No, n (%) | 450 (12.9) | 1535 (58.6) | 2936 (57.1) | 1453 (47.1) | 6374 (44.5) |
| Do not usually visit, n (%) | 87 (2.5) | 79 (3.0) | 194 (3.8) | 125 (4.1) | 485 (3.4) |
| Missing information, n (%) | 27 (0.8) | 51 (2.0) | 56 (1.1) | 22 (0.7) | 156 (1.1) |
| N in analysesa | 3364 | 2489 | 4890 | 2936 | 13679 |
| Noticed tobacco products displayed in kiosks | |||||
| Yes, n (%) | 2033 (58.5) | 645 (24.6) | 1194 (23.2) | 425 (13.8) | 4297 (30.0) |
| No, n (%) | 480 (13.8) | 1197 (45.7) | 2383 (46.4) | 2458 (79.7) | 6518 (45.5) |
| Do not usually visit, n (%) | 896 (25.8) | 705 (26.9) | 1467 (28.5) | 152 (4.9) | 3220 (22.5) |
| Missing information, n (%) | 69 (2.0) | 72 (2.7) | 96 (1.9) | 48 (1.6) | 285 (2.0) |
| N in analysesa | 2513 | 1842 | 3577 | 2883 | 10815 |
| Noticed tobacco products displayed in service stations | |||||
| Yes, n (%) | 1690 (48.6) | 488 (18.6) | 865 (16.8) | 750 (24.3) | 3793 (26.5) |
| No, n (%) | 411 (11.8) | 1056 (40.3) | 2081 (40.5) | 1238 (40.2) | 4786 (33.4) |
| Do not usually visit, n (%) | 1298 (37.3) | 989 (37.8) | 2077 (40.4) | 1057 (34.3) | 5421 (37.9) |
| Missing information, n (%) | 79 (2.3) | 86 (3.3) | 117 (2.3) | 38 (1.2) | 320 (2.2) |
| N in analysesa | 2101 | 1544 | 2946 | 1 988 | 8579 |
Measures
Noticing tobacco product displays was measured separately for shops (i.e. smaller local grocery stores and large supermarkets), kiosks and service stations with the question: ‘During the last 30 days, have you noticed tobacco products displayed in following places near your home, school or workplace?’; with options ‘Yes’, ‘No’ and ‘I do not usually visit this place’. In 2017, noticing of tobacco and of e-cigarettes were measured separately, as noticing e-cigarette displays was studied for the first time. Only responses of those who visited the places under study were included in the analyses, as the focus of this study was to measure the changes in exposure as a result of the POS display ban, not changes in visits. Table 1 also shows the number of respondents in the analyses.
Selected sociodemographic characteristics were used as controlling variables. Respondents’ age and gender were received from the Population Register Centre. Academic achievement was based on subjective assessment of their performance in school compared with the class average: ‘much or slightly better’, ‘about class average’, and ‘slightly or much poorer’. Smoking status was categorised into three groups: never-smokers, experimenters (as having tried smoking but not smoking daily) and daily smokers.
Data analysis
Noticing tobacco products was cross-tabulated with survey year by retailer type, age and gender. Prevalence of noticing e-cigarettes on display was separately calculated for each retailer type in 2017. Logistic regression analyses were then conducted by retailer type to test the association between survey year and exposure to tobacco displays. In these analyses, age, gender, smoking status and academic achievement were controlled for, as they may have influenced noticing tobacco products. For the adjusted prevalence of noticing tobacco products, direct adjustment was used with an equal weight applied to each group. A trend test was conducted with the Linear-by-Linear Association (LLA). IBM SPSS Statistics V.23 was used for data analyses.
RESULTS
Table 2 describes the proportions of noticing tobacco products on display in shops, kiosks and service stations by age and gender groups. In most of the groups, girls reported more observation of tobacco products compared to boys, and the 14-year-olds reported more observation of tobacco products compared to 12- and 16-year-olds. However, the proportion differences between groups were not systematic (Table 2).
Table 2
Percentage of 12- to 16-year-old adolescents who had noticed tobacco products on display in shops, kiosks, and service stations, in 2011−2017 in Finland, among adolescents who visited the places by age (years) and gender
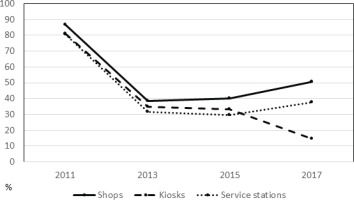
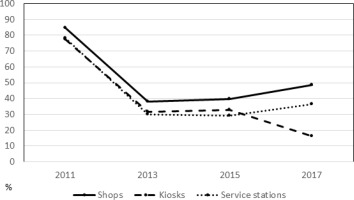
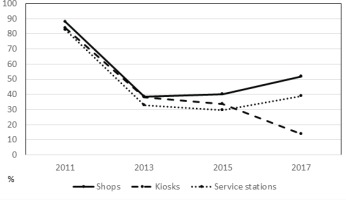
Figure 1 shows the proportions of 12- to 16-year-old adolescents reporting tobacco products on display in shops, kiosks, and service stations in Finland in 2011-2017. In 2011, over 80% of 12- to 16-year-olds had noticed tobacco products on display in shops, kiosks and service stations; in contrast, approximately one-third of adolescents had observed a tobacco product on display in 2013. From 2013 to 2015, the proportions remained quite stable. From 2015 to 2017, they further decreased for kiosks but slightly increased for shops and service stations (Figure 1). Figures 2 and 3 show the corresponding proportions for boys and girls, which are very similar to the proportions in Figure 1.
Figure 1
Percentages of 12- to 16-year-old adolescents, who visited the following places, reporting noticing tobacco products on display in shops, kiosks, and service stations in 2011−2017 in Finland

Figure 2
Percentages of 12- to 16-year-old boys, who visited the following places, reporting noticing tobacco products on display in shops, kiosks, and service stations in 2011−2017 in Finland

Figure 3
Percentages of 12- to 16-year-old girls, who visited the following places, reporting noticing tobacco products on display in shops, kiosks, and service stations in 2011−2017 in Finland

Compared to 2011, the odds ratios for noticing tobacco POS displays in 2013 ranged from 0.09 (95% CI: 0.08–0.11) for shops to 0.13 (95% CI: 0.11–0.15) for kiosks (Table 3). Table 3 also shows the adjusted proportions for noticing tobacco products on display in shops, kiosks, and service stations, which slightly differ from the unadjusted estimates in Figure 1. Trends over years 2011–2017 and 2013–2017 were statistically significant in all retailer types (p<0.001) (Table 3).
Table 3
Prevalence (%) and odds ratios (95% confidence interval) of 12- to 16-year-old adolescents, who visited the following places, for noticing tobacco products on display in shops, kiosks, and in service stations, in 2011−2017, controlled for age, gender, smoking status and academic achievement, and prevalence (%) of 12- to 16-year-old adolescents, who visited the places, for noticing e-cigarettes on display in shops, kiosks, and in service stations in 2017 in Finland
| Year | Shops | Kiosks | Service stations | |||
|---|---|---|---|---|---|---|
| % | OR (95% CI)a | % | OR (95% CI)a | % | OR (95% CI)a | |
| Tobacco | ||||||
| 2011 | 86.9 | 1.00 | 81.7 | 1.00 | 81.1 | 1.00 |
| 2013 | 37.6 | 0.09 (0.08–0.11) | 34.6 | 0.13 (0.11–0.15) | 31.0 | 0.11 (0.10–0.13) |
| 2015 | 40.6 | 0.10 (0.09–0.12) | 34.7 | 0.13 (0.11–0.14) | 30.7 | 0.11 (0.09–0.12) |
| 2017 | 50.5 | 0.16 (0.14–0.18) | 16.1 | 0.04 (0.04–0.05) | 37.4 | 0.16 (0.14–0.18) |
| pb (2011–2017) | <0.001 | <0.001 | <0.001 | |||
| pb (2013–2017) | <0.001 | <0.001 | <0.001 | |||
| E-cigarettes | ||||||
| 2017 | 5.6 | 20.5 | 5.1 | |||
In 2017, 5.6% of 12- to 16-year-old adolescents had noticed e-cigarettes displayed in shops, 20.5% in kiosks and 5.1% in service stations (Table 3).
DISCUSSION
Our study reports a substantial decline in Finnish adolescents’ observation of tobacco products on display in shops, kiosks and service stations after implementation of the display ban. The decrease continued for kiosks for the measured six years, while a slight increase was observed for shops and service stations between 2015 and 2017. The proportions of adolescents’ observation of tobacco products were, though, much lower compared to the period preceding the ban. The proportions of those who had noticed e-cigarettes displayed in shops and service stations were smaller compared to tobacco.
In Ireland11, Scotland17 and Australia2, approximately 80% of adolescents reported noticing tobacco displays before the ban, in agreement with our pre-ban estimates. The decline in noticing tobacco displays was similar to ours in Ireland (81% to 22%)11, but less dramatic in England12 and Australia2. These proportions are shown in Table 4. To our knowledge, no previous study has reported exposure to e-cigarette displays. The adolescents reported substantially less exposure to e-cigarette displays compared to tobacco, which may be due to fewer retail outlets for e-cigarettes. Strong enforcement of the display ban on tobacco products and e-cigarettes is needed to ensure retailers’ long-term compliance with the law. Also, continued efforts should minimize minors’ exposure to tobacco products through open containers.
Table 4
The proportions (%) of noticing tobacco displays in Finland, Ireland, England, Scotland and Australia before and after the display ban
| Country | Before the ban (%) | After the ban (%) | Age group (years) | Research method |
|---|---|---|---|---|
| Finland | 12–16 | Biennial postal survey | ||
| Shops | 87 | 38 | ||
| Kiosks | 81 | 35 | ||
| Service stations | 80 | 32 | ||
| Ireland11 | 13–15 | Face-to-face in-home interview | ||
| Shops | 81 | 22 | ||
| England12 | 11–16 | Cohort study | ||
| Supermarkets | 60 | 46 | ||
| Scotland17 | 13–16 | School-based pupil survey | ||
| Supermarketsa | 80 | - | ||
| Smaller shopsa | 80 | - | ||
| Australia2 | 12–24 | Yearly telephone survey | ||
| All store types | 80 | 64 |
As tobacco displays have been found to increase smoking susceptibility and smoking behaviours (i.e. initiation, regular smoking)2-8,11,12,18, the observed decrease in exposure may have contributed to fewer smokers. From 2011, daily smoking among Finnish adolescents has decreased. The proportion of daily smokers prior to the display ban was 16% (2011), and following the ban, it was 12% (2013), 10% (2015) and 7% (2017)19. Findings from studies on the effects of display bans on cigarette smoking2-8 could in part explain the reduction in smoking prevalence in Finland.
Adolescents still reported noticing tobacco products at the POS in 2017, although the POS display ban had been in effect for several years. Adolescents may observe tobacco packages when the retailer opens the storage unit for customers purchasing tobacco. Another explanation may be the use of specific tobacco storage units with a plain number display, where numbers indicate different cigarette packages sold in the shop. These machines are placed under the supervision and direct vicinity of the cashier, but are operated by customers. It is possible that adolescents have started to perceive these as tobacco displays. This could be avoided by turning the number display to face the cashier instead of the customers, and limiting the operation of the machine to cashiers.
Noticing displayed tobacco somewhat increased in shops and service stations, following the immediate decrease upon implementation of the display ban. This may be a result of less compliance or an increased number of adolescents perceiving tobacco storage units as displays. It is, however, unclear why this would occur in some types of retailers, but not in all retailers. Increased efforts to enforce the ban may be needed in shops and service stations.
Limitations and strengths
Due to low response rates, the study sample may not be fully representative of the population. However, response rates were similar across years, and therefore, may not have biased the trend in observation of tobacco displays. A potential problem with the measure of noticing tobacco displays is what adolescents perceive as a ‘display’. After the display ban was implemented, the tobacco storage units were still frequently visible (although cigarette packages were covered), which may have overestimated participants’ perceived observation of tobacco displays. Additionally, self-reported data may have contributed to recall bias. Although exposure to displays may be somewhat misclassified as a consequence, it is unlikely that the misclassification changed over time. We therefore consider the results on trends sufficiently valid. Despite these limitations, this study was strengthened by a lengthy assessment following the display ban, as well as the large number of respondents who were surveyed across Finland.
CONCLUSIONS
In Finland, the proportion of adolescents noticing tobacco displayed at POS strongly declined after implementing a POS display ban. Findings from this study suggest that the display ban is being adhered to; therefore, we recommend implementation of the display ban with strong enforcement in other countries throughout Europe. The European Union was unsuccessful in implementing a display ban in the 2014 Tobacco Products Directive (TPD)20. In order to effectively implement display bans throughout Europe, consideration should be given to revising the EU TPD to include a display ban. Continued strong enforcement is also needed to ensure that the retailers comply with the ban.

